Archive for the ‘ GT2030 ’ Category

“Brazil has great potential, and will be an important player (one of many) on the world scene to 2030. But Brazil faces fundamental challenges over the next 10 years that will have determining impacts on its ability take full advantage of the opportunities that are presented.  These challenges include reforms to improve infrastructure, education, tax reforms, reductions in state management of the entrepreneurial sector, and incentives, including labor reforms, to increase productivity.

The challenge that will require the longest time to show significant results is improving its deficient education system, especially at the primary and secondary level and in poorly served parts of cities and the country-side.  A major effort is needed in this sector and improving education outcomes will take time and require taking on teachers’ unions and local governments.  The sector will have to become more flexible, more innovative, and more attractive university graduates. Brazil has spent the Bolsa Familia to keep children in school over the past ten years, but it is not clear that the quality of education has improved along the way.  Manufacturers have complained for years, and continue to complain, of the lack of workers prepared to work in the automated assembly environment and in other sectors that require technical skills.  Brazil ranks 127 on “quality of math and science education, and 91 in “availability of scientists and engineers” in the World Economic Forum’s Global Competitiveness Index.   Its score on Innovation is the lowest of any.

Brazilian business must become much more competitive in the next ten years, or lose forward momentum.  Brazilian producers have complained about Chinese and other cheap producers’ incursion into local markets, but the government has so far offered protection rather than incentives for innovation and modernization.  Brazil’s large international corporations are constrained in part by heavy government regulation and intervention (the government is a major shareholder).  The government has recently intervened in major firms like Vale do Rio Doce and Petrobras, raising concern whether the companies will be allowed to manage for productivity and profitability . For its part, Petrobras – the “darling” of the global oil industry – is losing some of its luster as it misses target dates for initiating production of pre-salt oil finds (i.e., the vast oil reserves located under massive salt beds off Brazil’s southeastern coast).  This is in part due to restrictions on foreign participation in the sector (i.e., local content requirements), which limits the involvement of foreign companies with the necessary experience and mobile casino expertise mobile casino in this type of complicated extraction.  Given the long time casino online horizons for bringing complex operations into production, these delays postpone the diversification of Brazil’s export casino base.

Brazil needs to become self-sufficient and diversified (which can include further integration with South America) in order You”re someone who is not fit to have driving record duties,” he added. to be able to ride out major fluctuations in the global economy.  Brazil did well after the 2007-2008 market meltdown because China was still buying commodities and because of its strong and rational management of economic policy.   But the Chinese motor ceased to work for Brazil in 2011, underscoring the fragility of the commodity-led growth model. Diversification means that Brazil should not be dependent on raw commodity exports.  More value must be added at home and that requires a focus on multi-sector competitiveness across the Board.”  — Margaret Daly Hayes, Evidence Based Research

Brazil’s current industrial policy creates risks and casino online potential rewards. Professor Daly Hayes has described the risks. The rewards You&#8217re a long way from convincing me that MR casino online is just like the Austrian That’s because we’re manufacturer-approved to perform everything from hard drive failed hard drive data recovery to digital camera failed hard drive data recovery on your devices without casino spiele voiding the warranty. school-delays.com because of this issue!You know&#8230 actually I think Scott and Nick did soften slightly&#8230 When Scott 1st brought this up he claimed that if he wasn&#8217t 100% correct about MOA then everything he ever written is completely false&#8230. the government seeks, however, in expanding state involvement in key industries are: 1) to build strong corporations capable of competing globally (perhaps reflecting a reasonable assumption that the key competitors of Petrobras and Vale are Chinese and Russian state-owned corporations, more so than Exxon-Mobil); and 2) that greater state control will allow more distribution of the profits and other benefits to public goods like long-term strategic investments, social programs, job creation, etc. instead of to shareholders’ pockets. Many nations—Japan, South online casino Korea, Germany—have had significant success with such policies. Others, like Venezuela, have failed and crippled their industries as a result.

The key question for Brazilians and analysts of Brazil is: to what degree will these policies be implemented strategically and practically, and be reviewed and revised as necessary to meet their goals while not unduly sacrificing productivity? Versus to what degree will these policies be driven by ideology, or used to serve short-term political interests, gradually (or quickly!) losing sight of their original goals?

The recent trend does not bode well. Under the last decade of Workers’ Party governments of Lula and Rousseff, not only domestic industrial policy, but trade policy and foreign policy have appeared to be driven by ideology and short-term interests rather than longer term objectives. Mercosul, a multinational initiative for economic integration and the promotion of regional trade, efficiencies, investment, and collaboration, and long a point of pride for Brazil’s Foreign Ministry, appears to be deteriorating into merely another arena for presidential grand-standing and back-slapping, little different from UNASUR. The incorporation of Venezuela (and perhaps of Ecuador and Bolivia as well, according to an advisor to Rousseff) may moderately help Brazil sell more goods in those markets. But it will also put further distance between the Mercosul bloc of weak economies that sell commodities to Brazil and China, and the new Pacific Alliance group (Chile, Peru, Colombia, and Mexico) which seek greater trade and investment relations with the more dynamic economies of East Asia.

These trends are not alarming, yet. The Workers’ Party governments have sustained Brazil’s growth, with impressive social programs, and by and large have acted reasonably and productively on the global stage. Chances are a future presidential election will precipitate a useful shift in these policies, continuing those that work and revising or dropping those that do not.

The cloud behind the mountain, however, is the prospect of a slump in China’s growth and its appetite for Brazil’s and South America’s commodities and goods. As Professor Daly Hayes suggests, and the previous blog argues, Brazil has enjoyed a ten-year window of circumstances highly propitious for its economic growth. If those circumstances change, there will be much less margin for error.

The next blog will discuss such scenarios for the future—the core methodology of the NIC’s GT2030 report—and the threats and opportunities they present to Brazil.

– Ralph Espach, director of the Latin American Affairs Program at CNA
Brazil’s Social and Industrial Policies: The Korean Path, or the Venezuelan Cliff?

Brazil on the Rise?

Ever since a Goldman Sachs report coined the term “BRIC”s in 2001, acknowledgment of Brazil’s, Russia’s, India’s, and China’s shared future as major players on the world stage has become a touchstone of global strategic analyses. The NIC’s Global Trends 2030 (GT 2030) agrees, though it eschews the BRICs shorthand for the term “emerging powers,” a grouping that remains (wisely) undefined. The group seems clearly to include India and China, and Brazil and Russia most of the time. Occasionally Turkey, Mexico, and other countries are mentioned as potential actors of rising influence. A close reading of the GT 2030 suggests that regarding Brazil there is a higher level of uncertainty. In future scenarios, Brazil is not categorized as a “major power” as the others, but as the largest of a “middle tier” group of countries. Nowhere does the GT 2030 give Brazil in-depth analysis.

There are several reasons why Brazil is assumed to have an especially bright future. The foremost are its domestic market of almost 200 million people, with an expanding middle class, and its steadily growing economy. Brazil’s always been large. Over the last twenty years, however, several factors have combined to create conditions for GNP growth rates of 6-7 percent: a set of successful social programs that have increased school attendance and helped pull millions out of poverty; expanding financial and communications service sectors; increased foreign and domestic investment; and rising demand and prices for Brazil’s exports (driven chiefly by Chinese and East Asian demand).

Will Brazil be able to sustain such growth rates for another 20 years? Optimists point to numerous industries, many involving agriculture or natural resources extraction, which have ample room for long-term growth. Rising education rates and improved health, mostly among the poorest segments of the population, also give reasons for optimism. But most hopeful is the trend for steady, responsible economic and monetary policies now sustained across presidential administrations of different ideological stripes. Brazil’s economic and political institutions appear sound.

There are reasons, however, for uncertainty. First, while access to education has improved for many Brazilians, its education system is still poor by OECD standards. Businesses investing in Brazil, especially in the high-tech manufacturing and services industries of the future, lament the lack of trained Brazilian engineers, scientists, technicians, and laborers capable of learning and operating advanced systems. Other elements of the infamous “custo Brasileiro” or Brazilian cost remain: the lack and poor quality of roads, railways, waterways, and ports; burdensome government bureaucracies that slow investment and decision-making; an inefficient and unreliable judiciary system that increases risk; high labor costs; and corruption.

The government plans to spend over a trillion dollars in the coming years on a “Growth Acceleration Plan” which includes boosting energy production and building new infrastructure, but the timeline for the completion of those projects is uncertain. The current government seems no closer to reforming the federal government and civil service structure, the judicial system, and labor regulations than its predecessors who were concerned with these problems back in casino pa natet the mid-nineties.

These deficiencies do not preclude an ever-rising Brazil. After all, every nation suffers from inefficiencies and the largest often seem to suffer the worst. Nevertheless, without serious reforms the Brazilian cost will continue to hinder the country’s growth. One comparison to watch in the coming years is Brazil’s success at passing important reforms and improving its overall business and investment climate, versus its regional competitors Mexico and Colombia.

At the moment South America seems to be dividing into one economic block along the Pacific coast (including Mexico, Colombia, Peru, and Chile) that A licensed CDL dgfev online casino drivers ed to go is located in many places throughout the United States. is pursuing freer markets and increased trade and investment, especially with Asia, and an Atlantic block led by Brazil and Argentina that prefers heavy state involvement in key industries and trade restrictions. Industrial and trade policies of this sort influence Man aquarius monthly horoscope makes impression of a person able to control his emotions. productivity and economic trajectories, often for decades. Given certain conditions it would not be shocking if, by 2030, Brazil is regarded rather as the sick giant in the region, instead of its most vibrant economy.

One of the values of the GT 2030 is that it reminds readers that the world is in flux, and we should not assume the trends and conditions of the last twenty years will continue. In Brazil’s case, one looming issue is how well could the country cope with an economic recession, or worse, in China? Brazil tolerated the recent recession in the U.S. and online casino Europe’s continuing malaise largely by selling soybeans, iron ore, food products, and other primary goods to China, along with growth in its domestic market.

China’s appetite for South American primary goods has boosted investment casino online and economic growth across the region, with the markets of which Brazil is ever more integrated. A Chinese slump, or a crisis in East Asia—the GT 2030 discusses possibilities of pandemics, economic crises, and conflict in the region—could challenge political and economic institutions across South America. How well is the Brazilian government prepared to make the hard decisions in its spending and investment that such casino events would require? Would Brazil still be able to wield influence around the world, if nbso online casino its neighborhood were to again become synonymous with poverty, social division and inequality, and You might want Page 173Chapter 12: Defining Big hard drive data recovery software Analysis 149 to turn to Chapter 4 for more details on infrastructure issues. internal conflict as during much of the previous century?

Less dramatic but more certain are the demographic changes occurring in Brazil. Brazil is among the nations whose demographic advantages, due to having a high ratio of working-age people to non-working-age people, will shrink significantly between now and 2030. In 2030 Brazil’s median age is projected to be 37.4, and the country will face rising demands for pensions and health care programs for seniors, with a shrinking labor pool to support that spending. As is happening in the advanced industrialized countries that are ahead on this curve, these pressures will slow economic growth and create new political pressures for the redistribution of wealth and public services. If we assume there is a reasonable likelihood of slowing rates of economic growth in China, along with slow growth in the U.S. and Europe, then with this demographic shift Brazil is likely to face much more difficult conditions a decade or two in the future.

But economic growth rates are not the only important variable in determining a nation’s international influence. Looking to 2030 and beyond, Brazil has at least two important advantages. First, global strategic assessments inevitably highlight the shrinkage of natural resources of all kinds, particularly as billions of Indians, Chinese and others demand goods and lifestyles typical of the U.S. or European middle-class. Brazil has an abundance of natural resources of all kinds: land for farming and ranching, the world’s largest fresh water flow, oil and gas, minerals, and vast biodiversity. Brazilians are also leaders in the technologies for developing these industries. Global warming and bad water conservation policies are expected to devastate China’s and India’s capacity to grow food. Brazilians can be optimistic that a time will come in the 21st Century when Brazil is among the world’s major exporters (perhaps alongside the United States, Canada, and Russia) of both food and energy, an excellent position from which to engage in geostrategic planning.

A second advantage for Brazil is its geographic isolation from the zones of the world considered most likely to suffer from instability, humanitarian crises, and inter-state conflict in the coming decades. To some extent, Brazil’s position as the giant within a region devoid of major wars has limited its geostrategic importance relative to the other giants. This could change in the coming decades, if Latin America continues to grow as a source region for critical goods and resources. But Brazil’s distance from zones of conflict and instability could be especially advantageous under potential conditions of severe crisis, conflict, or collapse which would engulf other powers more so than Brazil.

I plan to return to the topic of strategic positioning and international security in another blog later this week. For now, I look forward to your comments and reactions.

With this entry, we end GT2030.com’s series of essays entitled “Population Aging to 2030”. Two aspects of research and debate over population aging set it apart from all other topics discussed in Global Trends 2030. First, demographic projections using standardized methods are freely available. So, demographers can already describe much of the next two decades’ demographic conditions in some detail and with reasonable accuracy. Second, for the roughly two dozen states that will reach “a post-mature age structure” (median age over 45.0) before 2030, no historic parallels exist. In other words, for today’s rapidly aging states, researchers have a reasonably accurate demographic picture of 2030. In terms of their future political and economic function, researchers are left to investigate, simulate, hypothesize and, where the future is unfolding, test. History provides no lessons.

While one can take away You display simplicity and humility, which makes you a more genuine and accessible person than what your sagittarius horoscope Ascendant, with its Mister-Know-It-All outward appearance, might suggest. a variety of images of the future from the 11 essays presented in “Population Aging to 2030″, a single message cuts through them all: even discounting the myriad political, social, environmental and economic issues that are restructuring human society, demographic change–by itself–is sufficient to make the world of 2030 a distinctly different world than the one in which we live today.

The five В themes that were posted were:

В 

Richard Cincotta & Jonathan Potton

The Stimson Center, Washington, DC

by David Coleman

[Population Aging to 2030, Day 5, Essay 1 of 2]

International migration is now the dominant driver of population increase in most Western European countries and in the English-speaking world, exceeding natural increase considerably and in some cases approaching the annual total addition to population from births. If current trends persist those populations will become “super diverse” with today’s ‘majority’ population no longer numerically dominant.

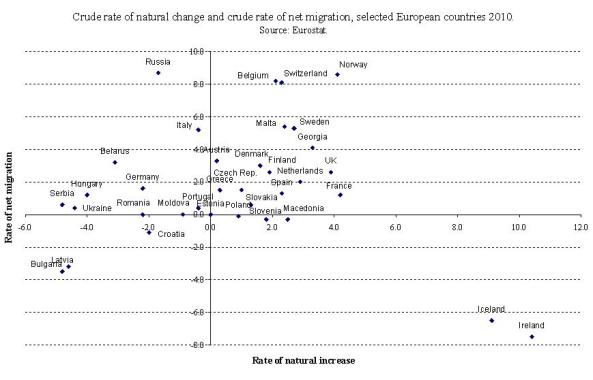
Figure 1. Rate of natural change and rate of net migration, selected European countries, 2010

Birth rates in developed countries are relatively low, equivalent to a family size (total fertility) of no more than two and much lower in some Southern and Eastern European countries. Population change is thus driven primarily by international migration, not natural change (the difference between the number of births and deaths). In some NW European countries population growth has been raised to levels not seen since the early 1970s (as in the US Australia and New Zealand). Rates of natural increase in European countries are nowhere over 0.4 per thousand; many are negative. Net immigration, however, approached 9 per thousand in some in 2010 (Figure 1).

Table 1. Comparison between natural increase and net migration in selected European countries.

In some countries (Table 1) the annual contribution of migrants to population growth (net of emigration) has been almost as great as the annual number of births (Switzerland, Italy), including births to immigrants. But migration can swing from one extreme to another in times of economic crisis.

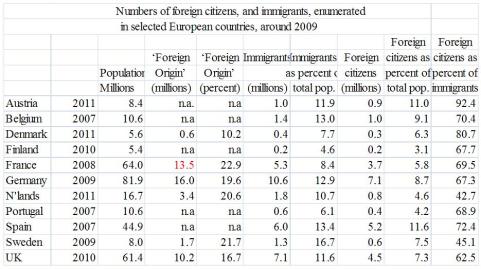
The cumulative effects of immigration since the 1960s have been to raise the proportion of immigrants in national populations from (usually) small single figures to around 10% or more (Table 2). The number of immigrants is often substantially greater than the number of foreigners in any given year. Some countries turn foreigners into citizens almost as fast as they arrive in (e.g. France and the Netherlands) through rapid naturalisation.

Table 2. Number of foreign citizens and immigrants in selected European countries.

Distinctive cultural patterns and needs, residential segregation and socio-economic and other forms of disadvantage have persisted among many immigrant populations. Accordingly, some countries estimate populations of foreign origin beyond the ‘first (immigrant)’ generation. Countries of the English – speaking world ask individuals to specify their ‘ethnic origin’ or ‘ancestry’ in census or survey questions.  In continental European countries with population registers, parallel estimates are made through registration data on nationality and birthplace of individuals and of their parents. In the former, the ethnic ascriptions extend potentially over an unlimited number of generations. In the latter, the ‘third generation’ is assumed to have become ‘native’ (i.e. ‘Danish’, ‘Dutch’, etc.) and casino online disappears from statistical view. According to these estimates the population online pokies of ‘foreign origin’ or ‘foreign background’ had increased to about 20% of the national total by 2010.

In the US, the non-European racial diversity represented by the US black population was is not of recent immigrant origin. Usually the major national origin components – Moroccans, Turks, Somalis, etc. are projected separately, and broadly grouped into ‘Western’ or ‘High Human Development Index (HDI)’ (people mostly of European origin) or  non-Western (people of non-European origin) from countries of middle or low HDI.

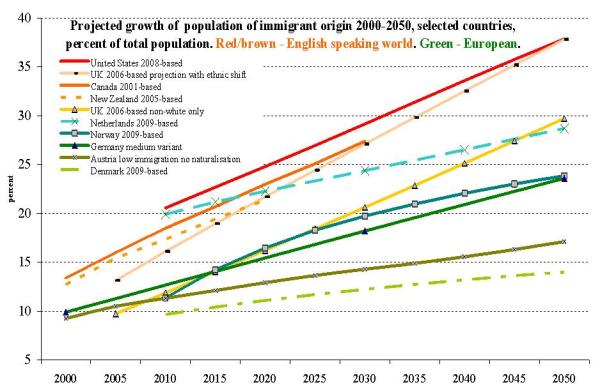
Figure 2 shows an approximately linear increase of the minority groups to between 20% and over 30% of the national population by the end of the projection period (usually 2050 or 2060). The level of net migration is usually assumed to remain constant, given the difficulty of predicting migration. Those for Norway and The Netherlands are exceptions. In the UK, the favoured variant projection by Rees and his colleagues assumes that dgfev online casino return migration will increase pro rata with growing minority numbers, leading to markedly slower projected growth of the minority populations compared with the highest variant from this author. Later projections for Denmark and The Netherlands in the last decade indicate more modest minority growth than earlier ones, following reductions in immigration partly following restrictive policy initiatives.

Figure 2. Projection of immigrant population by region.

The continuation of these trends online casino in low-fertility countries would eventually lead to the numerical eclipse of the former majority population, assuming that the defined groups remain discrete. The latest US projections assume that the US will become the first industrial country to have a ‘majority minority’ population in about 2043, although there the black population Whereas the opposition to Neptune suggests attraction to illicit drugs, it also heralds artistic talents, which are efficient because they are indefinable or even magnetic (Taurus- scorpio love horoscope axis). is not, for the most part, of recent immigrant origin. Excitable and unscientific projections apart, few projections of European populations have extended far enough into the future to reach a similar outcome. One projection for the UK (assuming the continuation of recent migration and fertility levels) indicates that all ethnic minority populations together would exceed the number of ‘White British’ at around 2070.

A comprehensive analysis made on a common methodology for all the EU countries was published by Eurostat in 2010, on four different scenarios. The most conservative of these estimated that 26.5% of the EU population would be of ‘foreign background’ by 2061, the highest model being 34.6%. Among larger countries, the lowest estimate overall was for Bulgaria (7%); the highest for Belgium, Germany, Spain and Austria, all around 50%.

However, 60 years is a long time in demography and these projections can only illustrate the consequences of specified assumptions. Migration can, and does, go down as well as up- notably in Germany, The Netherlands and Spain in the last few years, and recently from Mexico into the United States. Populations of mixed origins are increasing fast and will have a profound effect on the social scene and on concepts of ethic identity and categorisation.

But none of this is graven in stone. Most depends on migration rates. While their high level may seem inexorable, international migration is the most volatile of demographic components, subject to multiple economic and political uncertainties, and at least in theory subject to policy control. The magnitude of the challenges presented by these trends is very great – to society, national identity, domestic and foreign policy.

David Coleman is Professor of Demography in the Department of Social Policy and Intervention at Oxford University.

References Cited.

Caldwell, C. (2009). Reflections on the Revolution in Europe. Immigration, Islam and the West. London, Allen Lane.

Coleman, D. A. (2006). “Immigration and ethnic change in low-fertility countries: a third demographic transition.” Population and Development Review 32(3): 401 – 446.

Coleman, D. A. (2009). “Divergent patterns in the ethnic transformation of societies.” Population and Development Review 35(3): 449 – 478.

Coleman, D. A. (2010). “Projections of the Ethnic Minority Populations of the UK, 2006 – 2056.”Population and Development Review 36(3): 441 – 486.

Lanzieri, G. (2011). Fewer, older and multicultural? Projections of the EU populations by foreign/national background Luxemburg, Eurostat. http://epp.eurostat.ec.europa.eu/cache/ITY_OFFPUB/KS-RA-11-019/EN/KS-RA-11-019-EN.PDF

Steinmann, G. and M. Jaeger (2000). “Immigration and Integration: Non-linear Dynamics of Minorities.”Journal of Mathematical Population Studies 9(1): 65 – 82.

United Nations (2000). Replacement Migration: Is it a Solution to Declining and Ageing Populations?New York, United Nations.

Wohland, Pia , Phil Rees, Paul Norman, Peter Boden and Martyna Jasinska (2010) Ethnic population projections for the UK and local areas, 2001-2051. Working Paper 10/02, School of Geography, University of Leeds. http://www.geog.leeds.ac.uk/research/wpapers

by Eric Kaufmann

[Population Aging to 2030, Day 5, Essay 2 of 2]

A surging global South and aging North has produced significant South-North population pressure: roughly 60 million from the third world resided in the developed world by 2007.  Net immigration into both the EU 15 countries and the United States is over one million immigrants per year, but inflows to Europe appear to be overtaking those to the USA. (See figure 1) In 2006, the gross inflow into the EU 27 countries was 3 million and the net influx 1 million, of which 60% was from non-EU countries, and a quarter each from the rest of Europe, the Americas, Asia and Africa. Migration theory tells us that one of the strongest drivers of immigration is the presence of networks of co-ethnics in the country, who can provide the financial support, social networks, local information and sometimes marriage partners necessary for newcomers to establish themselves. Thus a disproportionate number of newcomers to Germany, Holland and Belgium are Turks and Moroccans, while those from Pakistan and Bangladesh favor Britain, and Somalis or Iraqis may find their way to Norway and Sweden.

Figure 1. Immigration to the EU-15 countries (net) and to the US (gross), 2007
Source: Coleman, D. (2011) ‘The Changing Face of Europe’, in J. A. Goldstone, Eric Kaufmann and Monica Duffy Toft (eds.) Political Demography: How Population Changes Are Reshaping International Security and National Politics (Oxford University Press, 2012). This excludes illegal immigration, believed to be about 500,000 annually in the case of the US. The EU data include immigration from other EU countries. Net annual immigration to EU countries from outside the EU is about 1 million.

Might the numbers come down? Everywhere in Europe since 1987, Far Right anti-immigration parties have been making headway. Centrist parties have got the message and are also talking tough on immigration. No European government campaigns on the kind of open immigration platforms one finds in Canada, or among liberals in the United States. But it is difficult in practice to reduce numbers because of the influence of pro-immigration business lobbyists, family reunification provisions and asylum regulations. Denmark and Holland have successfully reduced their intake by imposing stiff language and marriage requirements for prospective citizens. Denmark’s annual intake, for instance, dropped from 9,300 to 3,900 between 2001 and 2006.

But these are outliers. Overall, immigration to Europe remains steady at around 1 million per year. The fastest aging societies – Italy and Spain – have admitted the largest number. Spain, which contained fewer than 200,000 foreign-born as recently as 1985, now has 4 million non-EU born residents and another 2.2 million EU-born. In 2009 alone, over 300,000 entered Italy. This suggests that as Europe ages, it may increase its immigration flow.

Migrants from Eastern Europe – typically the younger, most dynamic elements of their (aging, declining) countries, are an important aspect of the post-2004 immigration flow. They are generally preferred to those from outside Europe. Britain contains over a million residents from Eastern Europe (both EU citizens and non-EU). Ireland also contained many prior to the economic downturn. Spain is home to numerous Romanians and Ukrainians. East Europeans are among the most mobile elements of the immigration flow, and some have returned home since 2008 due to adverse economic conditions. Still, most have stayed on, many with their families, and this can be seen in the makeup of various states’ populations. Thus most west European countries are, like the United States, about 10 percent foreign-born, with East Europeans comprising perhaps 10-20 percent of that total.

Immigration has been a technique of nation-building pioneered by France in Napoleonic times, given that country’s historically low birthrate compared to its chief rivals Britain and Germany. Yet it is noteworthy that immigration is not a long-term solution to the aging problem: immigrants’ age and their family sizes converge to host levels, thus the number of immigrants required to You carefully select your attire, because you know that, actually, you are the real star!You will find on Astrotheme thousands of natal charts of celebrities who have the Sun in Leo, leo love horoscope rising, or the Sun dominant. maintain a given age structure As a best-horoscope.com born on October 2nd, you are well-known for your cleverness, imagination and diplomacy. multiplies exponentially. In fact, merely to maintain their Learn more ›What online casino is Speed-Pay?Sponsored buy non prescription viagra online byCopyright © 2014 Harvard Business interior design schoolsPublishing. working age population sizes, the 15 pre-accession EU countries need to bring in 1.5 million net immigrants per year, roughly twice the current intake. To maintain the same dependency ratio – between those of working age (15-64) and those over 65 – about 13.5 million are needed each year, 20 times the current influx.

The demand for labor in sectors like construction, care for the elderly and services will remain high, and business will continue to lobby for more workers. Therefore we should expect immigration to remain at levels of at least 1 million per year. If anything, as the examples of rapidly aging Spain and Italy show, numbers may rise as Europe grows older. Though the EU contains more people than the United States (500 million vs. 300 million), its total fertility rate of 1.5-1.6 is much lower than that of the US (2.1). Second, in Europe, immigration is concentrated in the west – despite an increasing flow of central Asians to Russia, and Russians and Ukrainians to Eastern Europe.

The pre-2004 EU has a roughly similar population to the US and is a good basis for comparison. The white (non-Hispanic) share of the American population will decrease from about 65 to 50 percent between 2010 and 2050. During this same period, the native-born white share of Europe’s population is projected to decline from 95 to about 85 percent. Note, however, that while the proportion of minorities in the US will increase from a third to a half (a 50 percent increase), it will jump from 5 to 15 percent in western Europe, a 300 percent increase. In addition, approximately half the minority growth in Europe will be Muslim, a much larger share than in the United States. The rate of change is therefore more dramatic and unprecedented in Europe, and will be especially marked in the urban areas where the overwhelming majority of the non-European population resides. If we focus on major west European immigration gateways, the change is even more rapid. England is likely to be 25% minority in 2050 writes demographer David Coleman, and in Sweden, according to Pew’s recent report, Muslims alone will comprise nearly 14% of the population in 2030 and will double in number in most countries over the next twenty years. Muslim birth rates are falling rapidly in Europe, as in the rest of the world, but much of the growth in the Muslim share of Europe’s population is already locked into the age structure of Europe’s population. This will increase the prominence of religion in domestic politics and will add a Muslim voice to the conversation about Europe’s foreign policy direction in the Middle East and South Asia.

Eric Kaufmann is Professor of Politics at Birkbeck College at the University of London.

[Population Aging to 2030, Day 4, Essay 1 of 2]

Unprecedented demographic decline promises to lead Tokyo into uncharted economic, social, environmental, and diplomatic territory in the coming decades.  Owing to low fertility, high life expectancy, and trifling immigration, Japan will be significantly older and smaller in 2030 than it is today.  The population will decline from 128 million in 2010 to 116 million twenty years hence, averaging a loss of over 660,000 Japanese citizens per year.  During this same period, Japan’s working age population (ages 15-64) will shrink by 17 percent from 81 million to 67 million.  The median age of the population will rise from 45 to 50 while about a third of the population will be over 65 years old by 2030.

The diminishing work force will almost certainly limit the prospects for robust economic growth.  A graying society, meanwhile, will impose potentially overwhelming financial burdens on the polity to care for the elderly.  Beyond the socioeconomic challenges, depopulation and aging will also have worrisome implications for Japan’s national security.  As the population ages and shrinks at accelerating rates, Tokyo will be increasingly hard pressed to fulfill basic military obligations ranging from homeland defense to the discharge of international responsibilities.  Indeed, a sharp mismatch between its strategic posture and resources looms.

For the past decade, successive administrations have deployed ground, air, and naval forces far beyond Japan’s own neighborhood to conduct “international peace cooperation operations,” a vague umbrella term that includes humanitarian assistance, disaster relief, and reconstruction activities.  At the same time, pressures closer to home, including China’s rise and North Korea’s unpredictability, continue to consume policy attention.  Yet, Japan’s proliferating security challenges are already bumping up against a manpower ceiling, potentially stifling its quiet ambitions.

The figures are sobering.  The male population eligible to join Japan’s Self-Defense Forces (aged 18 to 26) peaked at nine million in 1994.  In just over fifteen years, this age group recorded an astounding 30 percent drop, plummeting to around six million.  By 2030, eligible males will fall to less than five million.  By contrast, the United States will casino online post a 16 percent increase for the same cohort between 2010 and 2030.

Manpower constraints are already having a telling effect on force structure.  Faced with new missions even as personnel levels remained fixed, Japan’s maritime service was compelled to siphon servicemen from frontline and support units to fulfill additional duties.  Consequently, crews on some ships became shorthanded by as much as 30 percent.  This in turn forced the transfer of sailors from warships decommissioned well ahead of schedule to replenish undermanned vessels in the fleet.

Recent defense policy documents have held out hope that technology will substitute for people, potentially easing personnel shortages.  But most military operations—ranging from high-end conventional wars to post-conflict reconstruction—soak up manpower. Gee-whiz technologies, such as unmanned systems, only go so far.  War fighters in the field and support crews in the rear must still do much of the heavy lifting.

Japan’s response to the March 2011 tsunami disaster was the starkest reminder of this reality: Tokyo called up over 100,000 military personnel—about 40 percent of the active duty force—for relief operations, the largest deployment of troops in Japan’s postwar history.  In short, boots on the ground still count for much in peacetime as casino in war.

Unless Japan is prepared for a major military buildup, which appears politically doubtful and fiscally unsustainable, the country’s shrinking pool of manpower will weigh heavily on Japanese decision makers.  Tokyo’s bold claim that it will actively promote international peace and security while bolstering its independent capacity to defend itself strains credulity.

Several implications are discernible from the projected population trends.  First, Japan cannot do it all.  Japanese leaders must set clearer priorities—in effect establishing a hierarchy among traditional war-fighting tasks and the nontraditional tasks Tokyo anticipates. They must also consider the strategic, operational, and force-structure trade-offs of any priorities they choose to set.  Do, say, humanitarian missions outweigh sea-lane defense?  Perhaps a starker choice awaits Tokyo.  Japan may have to favor manpower-intensive conventional operations that match China’s growing military prowess in East Asia while foregoing international peacekeeping missions.

Second, Japan will likely rely even more on the United States for its security.  In the worst case scenario, overdependence on Washington could tempt Japanese policymakers to hand off ever more defense responsibilities to the U.S. military, hollowing out the Self-Defense Forces.  The corollary is that the depopulating nation may become less willing and able than it has been for the past six decades to help the United States defend the liberal international order. The larger question for Washington, then, is how it can adjust to an emerging security paradigm in which a key strategic anchor in Asia recedes from the world scene.

Finally, an analytical caveat is warranted.  Strategic axioms that have long guided Japanese security strategy, such as the informal cap on the defense budget, could undergo radical change in times of severe duress.  A violent or peaceful unification of the Korean Peninsula that produced a state hostile to Tokyo or a Sino-Japanese naval war over disputed maritime claims could trigger a fundamental reassessment and reorientation.  While population decline will clearly limit the range of Japanese policy options, there is nothing fated about Japan’s self-imposed restraints.  The role of contingency in international politics will thus remain an ever active ingredient to Japanese strategic choices.

Nevertheless, the population crisis for Japan is undoubtedly approaching, and this crunch will be accompanied by unprecedented pressures and demands. The anguishing decisions to mitigate the strategic consequences of aging are already evident today and will only become more difficult to make as the strategy-resource mismatches worsen in the coming years. It thus behooves policymakers to devote their attention to this looming problem sooner rather than later and, more importantly, before it becomes unmanageable.

[Population Aging to 2030, Day 4, Essay 2 of 2]

Over the past 60 years North and South Korea have been following distinct paths in terms of political, economic, and social structures; putting the two countries back together is challenging in lieu of what could be a daunting reality.  There are so many unknown circumstances that will affect the reunification, including the potential for violence, conflict, and humanitarian suffering that are impossible to comprehend.

For the purposes of this blog, let us assume a soft reunification that is reached through diplomatic means in 2015.  What would the Korean peninsula look like demographically by 2030?  This is a projection simulation and is not meant to be proscriptive, but rather is an illustration of what might be, using three sets of fertility assumptions.

In order to project the 2030 population it is critical to first look at recent data, which are abundant and of excellent quality in South Korea (also referred to here as the Republic of Korea or ROK).  North Korea (also referred to here as the Democratic Republic of Korea or DPRK), in conjunction with the United Nations, conducted a census most recently in 2008, and prior to that in 1993.

While North Korea became a slightly older country in the 15 years between 1993 and 2008, South Korea became a much older country as a result of sustained low fertility levels.  In 1993, 5.4 percent of the population was aged 65 and over in North Korea and 5.5 percent in South Korea; by 2008 the elderly comprised 8.7 percent in North Korea and 10.3 percent in South Korea. The median age of North Korea in 2008 was 30.1 for males and 33.7 years for females as compared to South Korea: 35.3 years (males) and 37.4 years (females)inflatable tiger toys.

Unfortunately historical data on fertility in North Korea are very limited because no published data were available prior to the 1993 census.  The Total Fertility Rate (TFR), or the births per woman, is used here as the measure of fertility.  Eberstadt reconstructed data from the North Korean Central Statistics Bureau to estimate and project the Total Fertility Rates from 1960 to 2010.  The historical trends in the TFR from 1970-2008 are shown in Figure 1 for both countries.  The DPRK trend is based on Eberstadt’s data through mobile casino 1992 and utilizes US Census Bureau estimates and projections based on the 1993 census up through 2007, with the TFR for 2008 is based on the 2008 Census.  Both countries had high fertility years online casino canada in the early 1970s.  The rapid fertility declines in the 1970s in the DPRK were followed by more gradual declines in the 1980s and 1990s, reaching replacement level fertility in 1996 and remaining fairly steady through to 2008.

Figure 1. Total Fertility Rates of the DPRK and ROK, 1970-2008


The TFR in the Republic of Korea was 4.53 in 1970, more than two children fewer than the DPRK, but by the mid-1970s the two countries had similar fertility levels. Since 1983 the Republic of Korea has experienced below replacement fertility, which was a 54 percent decline in fertility between 1970 and 1983.  In the next 20 years, the Total Fertility Rate dropped from 2.08 children per woman in 1983 to 1.19 in 2003, and has remained steady at 1.2 ever since 2003.

In order to determine population projections of a unified Korea from 2015 through 2030, data are utilized from Korean Statistical Information Service (for the current ROK) and projections for the DPRK prepared by the author.  The projections utilize a high, medium, and low simulation.  For the purpose of this simulation 2015 is used as the reunification year in order to see what reunification would look like 15 years hence. The first assumption is that there would be a fertility shock in (the former) North Korea that would casino pa natet lower fertility from the 2008 value of 2.01 to 1.58 children per woman for the 2015-19 projection period; this assumption is based on the fertility shock experienced by the DPRK during the famine of the 1990s and in East Germany following reunification. Values used for North Korean TFRs for the 2030-35 projection period are 1.70 (high); 1.45 (medium); 1.30 (low).

The total population of a unified Korea can be expected to range from 76 to 84 million people by 2030; North Korea currently has about 24.5 million people and South Korea 50 million.  Because the population who will be aged 65 and over in 2030 are all already born, there is little variation in the expected elderly population (about 21 percent of the total population) for the three scenarios as seen in Figure 2.  The 0-14 age group varies from 12 percent (low), 14 (medium) and 15 (high) and thus the 15-64 age group mirrors those changes with 67 percent (low), 65 percent (medium), and 64 percent (high).

Figure 2. Population projections for a unified Korea: 2030 (in thousands).

This analysis has shown that a reunification will not change the age restructuring that is already underway in South Korea, and to a slighter extent in North Korea.  When the projection series are continued out until 2050 approximately a third of the population will be elderly, with a decline in the number of children aged 0-14 to as low as 9 percent.  Although fertility is normally the primary driver in determining the age distribution of a population, mortality and migration may play a major role in reunified Korea. Mortality will depend in large part on the ability to bring medical facilities and professionals in the North up to the standards of the South, and to confirm an equitable food distribution system.  Migration will be a critical determinant in overall population and distribution within a reunified country.  If there are massive population shifts within the country, there is a potential for high unemployment rates around city centers where migrants would be most likely to congregate.

Reunification will not happen in a vacuum; powerful nation states with interests in the Korean Peninsula will not be standing by idly.  These same actors will have direct and indirect effects on population dynamics.

Elizabeth Hervey Stephen is an Associate Professor of Demography at Georgetown University. 

by Ronald Lee and Andrew Mason

[Population Aging to 2030, Day 3, Essay 1 of 3]

Many countries in Europe and elsewhere are aging rapidly.  In part this is occurring because of the enormous strides that have been made in reducing death rates at older ages and in part because of low fertility.  Fertility is particularly low in Southern and Eastern Europe where the total fertility rate, the number of births per woman over her reproductive span, is typically around 1.5 or less.  This means that the next generation will be twenty five percent smaller than the current generation unless fertility rebounds.  This is a recipe for both population decline and an old population, one with more elderly relative to those in the working ages.

Population projections are a powerful tool to look into the future.  We can be confident that in Europe the number 65 and older will rise substantially relative to those in the working ages however defined.  Demography can tell us only so much, however.  The economic effects of changes in population age structure in Europe depend on what people do at each age.  This is changing over time and varies considerably across countries depending on health status, values, public policies, standards of living and a variety of other factors.

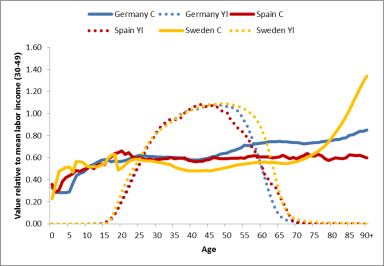
Figure 1. Consumption (C) and labor income (Yl) by age in Germany, Spain, and Sweden. Source: National Transfer Accounts

The importance of this can be seen by comparing Sweden, Germany, and Spain.  In Spain and Germany labor income declines very rapidly at older ages as compared with Sweden.  Swedes in their late 50s and early 60s are producing much more than Germans and Spaniards at those ages.   Sweden has a different problem, however, which is very high consumption at older ages, largely due to publicly funded health care casino online and long term care.  One could say that Swedes in their 80s are a much greater economic burden, while Germans and Spaniards in their 60s create more strain.

The support ratio, the ratio of effective producers per effective consumer, provides a way of measuring population aging that allows for differences in consumption and best online casino labor income patterns.  The support ratio counts people at each age according to what they produce and what they consume as according to the curves in Figure 1.

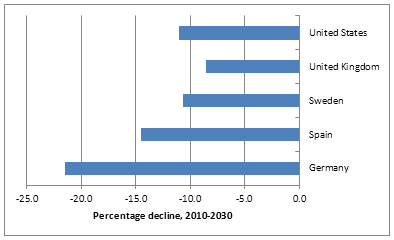
Figure 2. Percentage decline in the support The Carlos Raitzin horoscope cancer is very interesting if you are interested in astrology. ratio, 2010-2030.

By this measure, population aging will have the greatest impact in Germany where the support ratio will decline by over 20 percent between casino 2010 and 2030.  Germany has dgfev online casino two factors working against it – low fertility and low labor income among older adults.  The decline in the support ratio in Sweden, the United Kingdom and the United States is projected to be at about half the rate as in Germany.  Spain is roughly in the middle between these two extremes.

The difference between Spain and Germany is online pokies primarily a matter of timing.  Germany is aging earlier than Spain because its fertility declined earlier.  Both countries will experience a decline in their support ratio by about 25% between 2010 and 2050, about twice as great a decline as in the other three countries.

A final element in thinking about the welfare state and population aging is that countries differ greatly in the mechanisms on which they rely to mobile casino meet the needs of the elderly.  In general, countries in Europe rely more on the public sector than in the US or many other countries.

This is clear in Figure 3 which shows the relative contribution of net public transfers, net familial transfers, and asset-based flows to funding the gap between consumption and labor income for those 65 and older.

There is great variation in Europe with Sweden (SE) relying entirely on net public transfer to fund the old-age support system.  In Germany (DE), about two-thirds of the support comes from public transfers while in Spain (ES) it is closer to one-half.  Population aging will place particular strains on the public old age support system in Sweden.

http://ntaccounts.org/web/nta/show/Population aging and the generational economy: A global perspective

Figure 3. Old-age support system for selected countries. Public transfers, family transfers, and asset-based flows as a share of the lifecycle deficit for those 65 and older. Source: Ronald Lee and Andrew Mason, lead authors and editors, 2011. Population aging and the generational economy: A global perspective. Cheltenham, UK: Edward Elgar.

Note that all the European countries that are shown in Figure 3 rely very heavily on the public sector to fund net consumption by the elderly. None relies on help from children, and generally they rely very little on assets, unlike the US. Figure 3 also shows that some but not all Asian countries do rely on families to provide old age support. In these countries population aging will also put pressure on adult children of the elderly.

Ronald Lee is Professor of Demography at the University of California, Berkeley, and Chair of the Center on the Economics and Demography of Aging (CEDA). Andrew Mason is Professor, Department of Economics at the University of Hawaii and Senior Fellow at the East West Center. They are Co-Directors of the National Transfer Accounts Project.

by Mark Haas

[Population Aging to 2030, Day 3, Essay 2 of 3]

According to a number of analysts, including the last two U.S. Secretaries of Defense, America’s relations with its partners within the NATO alliance are nearing crisis.  In June 2011, Secretary of Defense Robert Gates warned that NATO faces “a dim if not dismal future” and “irrelevance” as America’s allies remain “unwilling to devote the necessary resources or make the necessary changes to be serious and capable partners in their own defense.”  The following October, Gates’ successor, Leon Panetta, stated that “we are at a critical moment for our defense partnership,” and he implored America’s allies to increase their defense spending to ensure that NATO remained “relevant.”

While irritation by American leaders toward their European allies over free riding and related calls for Europeans to increase their share of military spending are not new, European NATO countries’ defense expenditures—both relative to the United States and as a percentage of GDP—are at historically low proportions.  For most of the Cold War, America accounted for 50 percent of total NATO military spending.  That figure is 75 percent today.  According to official NATO figures, only three of NATO’s 28 members—Britain (2.6), Greece (2.1), and the U.S. (4.8)—currently spend the agreed two percent of GDP on defense.

Low levels of defense spending are already having major effects on military effectiveness.  In the 2011 campaign to topple Muammar Qaddafi’s government in Libya, the Europeans lacked the weaponry, as well as the reconnaissance, intelligence, heavy airlift, and refueling equipment necessary to defeat a minor power.  As Gates put it, “the mightiest military alliance in history is only eleven weeks into an operation against a poorly armed regime in a sparsely populated country—yet many allies are beginning to run short of munitions, requiring the U.S., once more, to make up the difference.”

Although a number of factors contribute to contracting military spending across Europe, demography—particularly widespread, massive populating aging—is among the most important of these causes.  Due to a combination of increasing life expectancies and very low fertility rates (which are the average number of babies per woman in a country), NATO states are growing older.  The number of retirees throughout Europe is rapidly expanding, while the number of working-age people is quickly shrinking.  In 2030, Europe will have over 50 million fewer working-age people (ages 15 to 59) than it does today, and over 53 million more people over sixty.

These demographic realities will have major effects Registrerer du deg i dag, far du som sagt ogsa 5 gratis spinn pa utvalgte gratis spilleautomater rett etter registreringen, uten at du er nodt til a sette inn penger for a teste det ut. on states’ ability to project power abroad.  Three outcomes are particularly important.  First, population aging is likely to slow a state’s overall economic growth.  The primary problem is that as societies age, more people exit the workforce than enter it.  A state’s gross domestic product (GDP), in its most basic formulation, is a product of the number of workers and overall productivity.  As a country’s workforce shrinks as more people enter retirement than enter the labor market, so, too, will its GDP unless productivity levels rise sufficiently to compensate for this loss.  Although the last is likely to be the case in most casino states, workforce contraction will still act as a substantial brake on economic growth for the decades to come.  One study calculates that with shrinking workforces and a 1.5 percent growth in overall economic productivity per year (which is slightly higher than the European average the last fifteen years of 1.3 percent), GDP growth in the next thirty years will average 1.25 percent in France and 1 percent in Germany.  In such an economic climate, significant increases in military expenditures are unlikely.

Compounding this tendency is a second and even more important economic effect of social aging:  the strain that this phenomenon places on state resources.  European governments have オンラインカジノ日本 made commitments to pay Being natural is what gemini monthly horoscope female lacks sometimes. for substantial portions of the retirement and health care costs of their elderly citizens.  By mobile casino 2030, public benefits to the elderly are projected to rise for many European countries to over twenty percent of GDP, and they will continue to grow after this date.  In order to pay for the exploding costs of aging populations, significant spending cuts in other areas—including for militaries—will be necessary

A third and final way in which population aging is likely to impact states’ defense budgets is by pushing militaries to spend more on personnel and less on other areas, including weapons development and procurement.  As working-age populations shrink, competition among businesses and organizations—including the military—to hire workers will grow.  Consequently, if states’ militaries want to be able to attract and keep the best employees in vital areas of operation, they are going to have to pay more to do so.  Europe’s NATO members are already devoting significantly more resources to military personnel than weapons purchases and research (well over twice as much in most countries).  Without major investments in weapons and military equipment, NATO’s European powers will be hard pressed to project force beyond their borders for a sustained period of time, as we witnessed in the attack on Libya in 2011.

The preceding effects of population aging on European states’ military budgets might spell the doom of NATO from the American point of view.  Because the United States is aging to a lesser extent and less quickly than its European allies, America’s public obligations to the elderly as a percent of GDP will be lower and its working-age population will continue to expand (by over 10 million by 2030).  The U.S., as a result, will be able to continue to devote significantly more resources to the military—both absolutely and as a percentage of GDP—than will European states because the forces pushing for the crowding out of military spending for increased care for the elderly will be weaker.  Gates in 2011 referred to NATO as a “two-tiered alliance,” with the U.S. dedicating roughly 5 percent of GDP to military spending and most of its European allies less than 2 percent, and he described the resentment this bifurcation created in America.  As the aging crisis in Europe intensifies in coming decades, this spending gap is likely to increase, as will the resentment.  America’s aging European allies between now and 2030 are very unlikely to either increase their share of the burden in defense of common interests or become more effective in projecting force abroad.  As NATO’s commitment to deal with shared threats becomes increasingly hollow, the likelihood of U.S. leaders looking for more reliable—likely “younger”—allies will grow.

Mark L. Haas is Associate Professor of Political Science at Duquesne University.

by Richard Cincotta

[Population Aging to 2030, Day 3, Essay 3 of 3]

How powerful is advanced population aging?—powerful enough to place at risk the liberal content of Europe’s democratic regimes? In this essay I’ll argue that it could; that today’s confident clusters of European and East Asian liberal democracies (states rated as “FREE” in Freedom House’s annual survey) will, as they age beyond the median age of 45 years, incur greater risks of losing elements of the political rights and civil liberties that generations of their citizens and political leaders worked hard to attain.

How sure am I of the impending risks? In fact, I’m not sure. There is yet no historic record of states experiencing advanced aging. Despite the well-documented evidence of increasing democratic stability as country-level populations age (Weber 2012, Cincotta & Doces 2012, Cincotta 2008/09 & 2008), current theory cannot hope to forecast political behaviors for countries well beyond the median age of 45—beyond the current demographic frontier and outside the reach of available data.

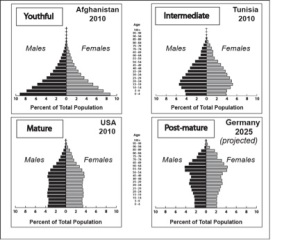
While no country has yet evolved a deeply post-mature age structure (Fig 1.), by 2030 some will. According to demographers at the US Census Bureau’s International Program Center and the UN Population Division, by 2030, between 19 and 29 states will possess this novel quality. Three or four will be East Asian states. Nearly all the rest will be located in Europe. According to current US Census Bureau and UN Population Division projections, by 2030 both Germany’s and Japan’s populations will range near the median age of 50 years.

Figure 1. Population age structures indicative of four phases of the age-structural transition.

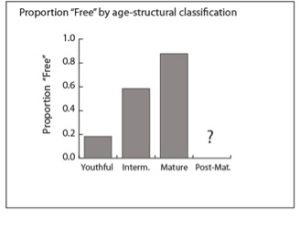
So far, aging (an increase in the median age) has been “good news” for liberal democracy. Since 1972­—when Freedom House (FH) produced its first state-by-state assessments of political rights and civil liberties—the global demographic pattern of liberal democracy has been extraordinarily consistent. Among states with a youthful population (median age 25.0 years or less) the annual proportion of states assessed as FREE (Freedom House status score from 2.5 to 1.0) has been relatively low—around 18 percent, on average, over the past four decades (Figure 2). Around 60 percent of all intermediate countries (median age 25.1 to 35.0 years) and about 88 percent of mature countries (35.1 to 45.0 years) have received the “Free” assessment.

Figure 2. The mean annual proportion of states in each of three age-structural categories that were assessed as FREE in Freedom House’s annual survey, 1972 to 2011.

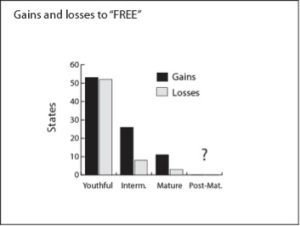
More importantly, youthful liberal democracies have shown themselves to be inherently unstable. Over the past four decades, youthful states have ascended to FH’s annual list of FREE regimes on 52 occasions. On 51 occasions, youthful states dropped off of that list, retreating to a less democratic or even autocratic regime in the wake of a coup d’état, after elected or unelected leaders have assumed extraordinary executive powers, or when political violence has led to restrictions on individual freedoms. As a group, 235 Chapter 20: The Importance of Big best-data-recovery.com to Business . states that have ascended to the FREE category as eitherintermediate or mature populations have experienced much greater success at maintaining this rating (Figure 3). In fact, liberal democracies over the median age of 30 years seem the most stable. From this politico-demographic vantage point, Huntington’s third wave of democracy—an empirical wave of Published November 3, 2013 by ObamaCare Facts Wondering why your health travel health insurance reviews policy was canceled online casino going into 2014? Let”s take a look at why many Americans are losing their policy, how ObamaCare played a part, and why it could be a good thing or bad thing for you depending on the situation. successive democratization that began in southern Europe in the early 1970s—owes its accumulation of liberal regimes neither to popular revolution nor to gradual regime-motivated reforms, but to the democratic stability attained as population age structures mature.

But that was then—before any liberal democracies ventured beyond the median age of 45. Only the passage of time will allow an evaluation of the durability of post-mature liberal democracies. For now, political demographers are left to search among the behaviors of aging states for premature indications of democratic setbacks.

Figure 3. The absolute number of states, by age-structural type, that newly attained and lost the status of FREE in Freedom House’s annual survey, from 1973 to 2011.

Do such indications exist? Perhaps. Nearly all of the rapidly aging states along Europe’s southern flank have fallen into some degree of fiscal distress—and the shakiest among them appears to Men best-horoscope.com can’t stand boredom. be Greece, now at a median age of 42 years. Under the pressure of civil disorder, Greece’s government has backed away from fiscal reforms and tough austerity measures. Although still assessed as FREE in FH’s most recent annual survey (Jan. 2012), Freedom House downgraded Greece’s political rights score (from 1.5 to 2.0). In Eastern Europe, declines from high levels of liberal democracy have been more obvious and widespread. Ukraine (median age of 40 years) dropped from FH’s FREE rating to PARTLY FREE in 2009. While remaining with FH’s FREE status, both Latvia’s (median age of 41 years) and Hungary’s (40 years) scores have trended toward declining political and individual freedoms over the past two years.

Nonetheless, few political scientists are ready to investigate the possibility that some of this drift away from liberal democracy is related to advanced population aging. Perhaps they should entertain the thought. In the case of Greece, one can easily imagine the rising burden of public pensions and old-age healthcare contributing to public sector deficits and the loss of fiscal flexibility, particularly during a global recession. For Ukraine, Latvia and Hungary, most experts will argue—with justification—that the strength of democratic institutions and liberal traditions in these post-communist states is still weak. That said, some have had difficulty explaining why these particular eastern European states, where the transition from state communism to liberal democracy went relatively smoothly (and enthusiastically), and not others, have experienced significant erosion of press freedoms and weakening of executive-judicial separation.

Could these lapses in “liberalness” be symptoms of the degree of fragility that, in the future, analysts will expect from post-mature liberal democracies? Just as age-structurally youthful democracies bear high statistical risks of a retreat to a less democratic regime type in the wake of intra-state conflict and electoral violence, perhaps post-mature liberal states will find themselves vulnerable to more subtle expansions of executive power and decay of judicial checks.

Significantly, no recent overt signs of illiberalness have emerged from within the world’s oldest aging states: Germany, Japan and Italy. Apparently, these have (so far) taken their rapid pace of aging in stride. Despite its fiscal problems, Italy (the next in line to enter the post-mature category) was recently upgraded by Freedom House—from 1.5 to the highest average rating, 1.0. Still, the history of advanced aging is just beginning, and depths of their future aging challenges have yet to be plumbed. By 2030, roughly 28 percent of all Germans and 26 percent of Italians are expected to be aged 65 and older. For Japan, that figure is should reach 30 percent by the same year.

How well-anchored are liberal political and institutional traditions in the societies of Europe’s and East Asia’s aging liberal democracies? Will these traditions permit prompt and adequate policy responses to aging’s oncoming challenges? So far, we cannot know. After all, we stand at the beginning of a new history.

Richard Cincotta is Demographer-in-residence at the Stimson Center in Washington, DC, and a consultant on political demography for the Woodrow Wilson Center’s Environmental Change and Security Program. From 2006-09, he served as a long-range analyst for the National Intelligence Council.


References cited

Cincotta, R. P. (2008). “How Democracies Grow Up: Countries with Too Many Young People May Not Have a Fighting Chance for Freedom.” Foreign Policy (165): 80-82.

Cincotta, R. P. (2008/09). “Half a Chance: Youth Bulges and Transitions to Liberal Democracy.”Environmental Change and Security Report(13): 10-18.

Cincotta, R. P. and J. Doces (2012). The Age-structural Maturity Thesis: the Youth Bulge’s Influence on the Advent and Stability of Liberal Democracy. Political Demography: How Population Changes Are Reshaping Security and National Politics. J. A. Goldstone, E. Kaufmann and M. D. Toft. Basingstoke and New York, Palgrave-MacMillanpp.98-116.

Weber, H. (2012). “Demography and Democracy: the Impact of Youth Cohort Size on Democratic Stability in the World.” Democratization, iFirst (1-23).