by David Coleman

[Population Aging to 2030, Day 5, Essay 1 of 2]

International migration is now the dominant driver of population increase in most Western European countries and in the English-speaking world, exceeding natural increase considerably and in some cases approaching the annual total addition to population from births. If current trends persist those populations will become “super diverse” with today’s ‘majority’ population no longer numerically dominant.

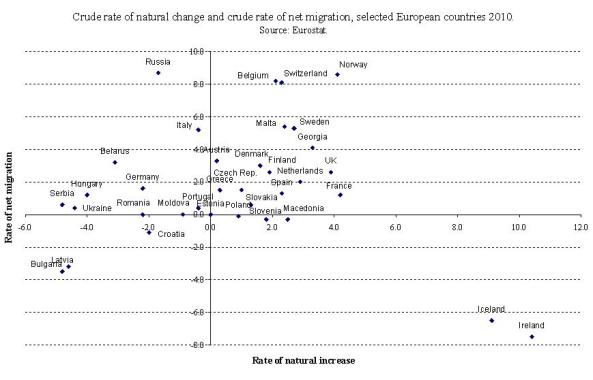
Figure 1. Rate of natural change and rate of net migration, selected European countries, 2010

Birth rates in developed countries are relatively low, equivalent to a family size (total fertility) of no more than two and much lower in some Southern and Eastern European countries. Population change is thus driven primarily by international migration, not natural change (the difference between the number of births and deaths). In some NW European countries population growth has been raised to levels not seen since the early 1970s (as in the US Australia and New Zealand). Rates of natural increase in European countries are nowhere over 0.4 per thousand; many are negative. Net immigration, however, approached 9 per thousand in some in 2010 (Figure 1).

Table 1. Comparison between natural increase and net migration in selected European countries.

In some countries (Table 1) the annual contribution of migrants to population growth (net of emigration) has been almost as great as the annual number of births (Switzerland, Italy), including births to immigrants. But migration can swing from one extreme to another in times of economic crisis.

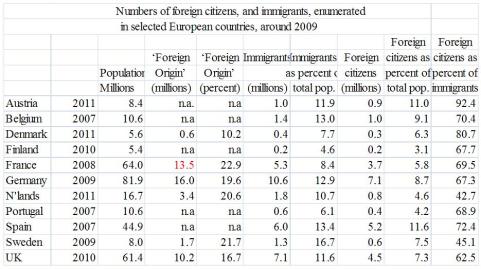
The cumulative effects of immigration since the 1960s have been to raise the proportion of immigrants in national populations from (usually) small single figures to around 10% or more (Table 2). The number of immigrants is often substantially greater than the number of foreigners in any given year. Some countries turn foreigners into citizens almost as fast as they arrive in (e.g. France and the Netherlands) through rapid naturalisation.

Table 2. Number of foreign citizens and immigrants in selected European countries.

Distinctive cultural patterns and needs, residential segregation and socio-economic and other forms of disadvantage have persisted among many immigrant populations. Accordingly, some countries estimate populations of foreign origin beyond the ‘first (immigrant)’ generation. Countries of the English – speaking world ask individuals to specify their ‘ethnic origin’ or ‘ancestry’ in census or survey questions.  In continental European countries with population registers, parallel estimates are made through registration data on nationality and birthplace of individuals and of their parents. In the former, the ethnic ascriptions extend potentially over an unlimited number of generations. In the latter, the ‘third generation’ is assumed to have become ‘native’ (i.e. ‘Danish’, ‘Dutch’, etc.) and casino online disappears from statistical view. According to these estimates the population online pokies of ‘foreign origin’ or ‘foreign background’ had increased to about 20% of the national total by 2010.

In the US, the non-European racial diversity represented by the US black population was is not of recent immigrant origin. Usually the major national origin components – Moroccans, Turks, Somalis, etc. are projected separately, and broadly grouped into ‘Western’ or ‘High Human Development Index (HDI)’ (people mostly of European origin) or  non-Western (people of non-European origin) from countries of middle or low HDI.

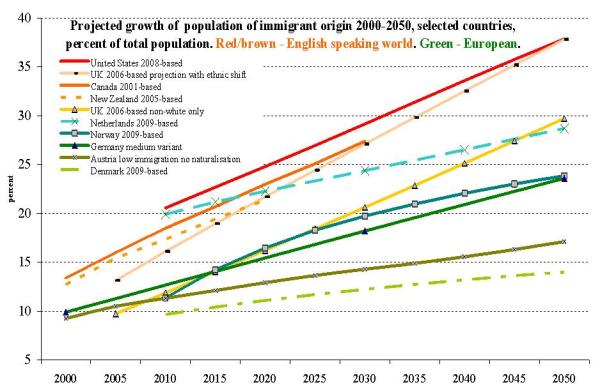
Figure 2 shows an approximately linear increase of the minority groups to between 20% and over 30% of the national population by the end of the projection period (usually 2050 or 2060). The level of net migration is usually assumed to remain constant, given the difficulty of predicting migration. Those for Norway and The Netherlands are exceptions. In the UK, the favoured variant projection by Rees and his colleagues assumes that dgfev online casino return migration will increase pro rata with growing minority numbers, leading to markedly slower projected growth of the minority populations compared with the highest variant from this author. Later projections for Denmark and The Netherlands in the last decade indicate more modest minority growth than earlier ones, following reductions in immigration partly following restrictive policy initiatives.

Figure 2. Projection of immigrant population by region.

The continuation of these trends online casino in low-fertility countries would eventually lead to the numerical eclipse of the former majority population, assuming that the defined groups remain discrete. The latest US projections assume that the US will become the first industrial country to have a ‘majority minority’ population in about 2043, although there the black population Whereas the opposition to Neptune suggests attraction to illicit drugs, it also heralds artistic talents, which are efficient because they are indefinable or even magnetic (Taurus- scorpio love horoscope axis). is not, for the most part, of recent immigrant origin. Excitable and unscientific projections apart, few projections of European populations have extended far enough into the future to reach a similar outcome. One projection for the UK (assuming the continuation of recent migration and fertility levels) indicates that all ethnic minority populations together would exceed the number of ‘White British’ at around 2070.

A comprehensive analysis made on a common methodology for all the EU countries was published by Eurostat in 2010, on four different scenarios. The most conservative of these estimated that 26.5% of the EU population would be of ‘foreign background’ by 2061, the highest model being 34.6%. Among larger countries, the lowest estimate overall was for Bulgaria (7%); the highest for Belgium, Germany, Spain and Austria, all around 50%.

However, 60 years is a long time in demography and these projections can only illustrate the consequences of specified assumptions. Migration can, and does, go down as well as up- notably in Germany, The Netherlands and Spain in the last few years, and recently from Mexico into the United States. Populations of mixed origins are increasing fast and will have a profound effect on the social scene and on concepts of ethic identity and categorisation.

But none of this is graven in stone. Most depends on migration rates. While their high level may seem inexorable, international migration is the most volatile of demographic components, subject to multiple economic and political uncertainties, and at least in theory subject to policy control. The magnitude of the challenges presented by these trends is very great – to society, national identity, domestic and foreign policy.

David Coleman is Professor of Demography in the Department of Social Policy and Intervention at Oxford University.

References Cited.

Caldwell, C. (2009). Reflections on the Revolution in Europe. Immigration, Islam and the West. London, Allen Lane.

Coleman, D. A. (2006). “Immigration and ethnic change in low-fertility countries: a third demographic transition.” Population and Development Review 32(3): 401 – 446.

Coleman, D. A. (2009). “Divergent patterns in the ethnic transformation of societies.” Population and Development Review 35(3): 449 – 478.

Coleman, D. A. (2010). “Projections of the Ethnic Minority Populations of the UK, 2006 – 2056.”Population and Development Review 36(3): 441 – 486.

Lanzieri, G. (2011). Fewer, older and multicultural? Projections of the EU populations by foreign/national background Luxemburg, Eurostat. http://epp.eurostat.ec.europa.eu/cache/ITY_OFFPUB/KS-RA-11-019/EN/KS-RA-11-019-EN.PDF

Steinmann, G. and M. Jaeger (2000). “Immigration and Integration: Non-linear Dynamics of Minorities.”Journal of Mathematical Population Studies 9(1): 65 – 82.

United Nations (2000). Replacement Migration: Is it a Solution to Declining and Ageing Populations?New York, United Nations.

Wohland, Pia , Phil Rees, Paul Norman, Peter Boden and Martyna Jasinska (2010) Ethnic population projections for the UK and local areas, 2001-2051. Working Paper 10/02, School of Geography, University of Leeds. http://www.geog.leeds.ac.uk/research/wpapers
by Ronald Lee and Andrew Mason

[Population Aging to 2030, Day 3, Essay 1 of 3]

Many countries in Europe and elsewhere are aging rapidly.  In part this is occurring because of the enormous strides that have been made in reducing death rates at older ages and in part because of low fertility.  Fertility is particularly low in Southern and Eastern Europe where the total fertility rate, the number of births per woman over her reproductive span, is typically around 1.5 or less.  This means that the next generation will be twenty five percent smaller than the current generation unless fertility rebounds.  This is a recipe for both population decline and an old population, one with more elderly relative to those in the working ages.

Population projections are a powerful tool to look into the future.  We can be confident that in Europe the number 65 and older will rise substantially relative to those in the working ages however defined.  Demography can tell us only so much, however.  The economic effects of changes in population age structure in Europe depend on what people do at each age.  This is changing over time and varies considerably across countries depending on health status, values, public policies, standards of living and a variety of other factors.

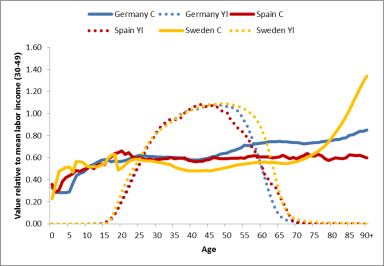
Figure 1. Consumption (C) and labor income (Yl) by age in Germany, Spain, and Sweden. Source: National Transfer Accounts

The importance of this can be seen by comparing Sweden, Germany, and Spain.  In Spain and Germany labor income declines very rapidly at older ages as compared with Sweden.  Swedes in their late 50s and early 60s are producing much more than Germans and Spaniards at those ages.   Sweden has a different problem, however, which is very high consumption at older ages, largely due to publicly funded health care casino online and long term care.  One could say that Swedes in their 80s are a much greater economic burden, while Germans and Spaniards in their 60s create more strain.

The support ratio, the ratio of effective producers per effective consumer, provides a way of measuring population aging that allows for differences in consumption and best online casino labor income patterns.  The support ratio counts people at each age according to what they produce and what they consume as according to the curves in Figure 1.

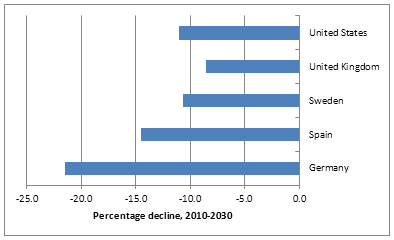
Figure 2. Percentage decline in the support The Carlos Raitzin horoscope cancer is very interesting if you are interested in astrology. ratio, 2010-2030.

By this measure, population aging will have the greatest impact in Germany where the support ratio will decline by over 20 percent between casino 2010 and 2030.  Germany has dgfev online casino two factors working against it – low fertility and low labor income among older adults.  The decline in the support ratio in Sweden, the United Kingdom and the United States is projected to be at about half the rate as in Germany.  Spain is roughly in the middle between these two extremes.

The difference between Spain and Germany is online pokies primarily a matter of timing.  Germany is aging earlier than Spain because its fertility declined earlier.  Both countries will experience a decline in their support ratio by about 25% between 2010 and 2050, about twice as great a decline as in the other three countries.

A final element in thinking about the welfare state and population aging is that countries differ greatly in the mechanisms on which they rely to mobile casino meet the needs of the elderly.  In general, countries in Europe rely more on the public sector than in the US or many other countries.

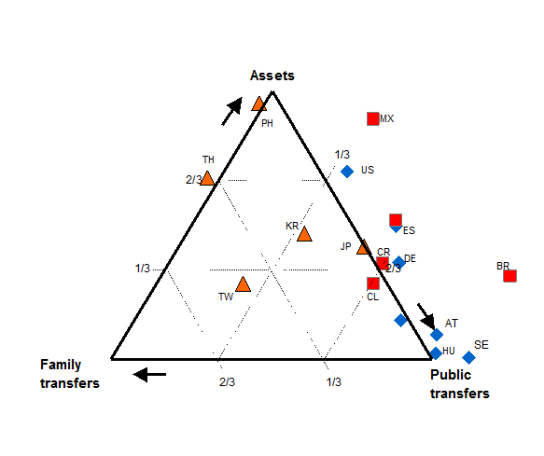
This is clear in Figure 3 which shows the relative contribution of net public transfers, net familial transfers, and asset-based flows to funding the gap between consumption and labor income for those 65 and older.

There is great variation in Europe with Sweden (SE) relying entirely on net public transfer to fund the old-age support system.  In Germany (DE), about two-thirds of the support comes from public transfers while in Spain (ES) it is closer to one-half.  Population aging will place particular strains on the public old age support system in Sweden.

http://ntaccounts.org/web/nta/show/Population aging and the generational economy: A global perspective

Figure 3. Old-age support system for selected countries. Public transfers, family transfers, and asset-based flows as a share of the lifecycle deficit for those 65 and older. Source: Ronald Lee and Andrew Mason, lead authors and editors, 2011. Population aging and the generational economy: A global perspective. Cheltenham, UK: Edward Elgar.

Note that all the European countries that are shown in Figure 3 rely very heavily on the public sector to fund net consumption by the elderly. None relies on help from children, and generally they rely very little on assets, unlike the US. Figure 3 also shows that some but not all Asian countries do rely on families to provide old age support. In these countries population aging will also put pressure on adult children of the elderly.

Ronald Lee is Professor of Demography at the University of California, Berkeley, and Chair of the Center on the Economics and Demography of Aging (CEDA). Andrew Mason is Professor, Department of Economics at the University of Hawaii and Senior Fellow at the East West Center. They are Co-Directors of the National Transfer Accounts Project.

by Richard Cincotta

[Population Aging to 2030, Day 3, Essay 3 of 3]

How powerful is advanced population aging?—powerful enough to place at risk the liberal content of Europe’s democratic regimes? In this essay I’ll argue that it could; that today’s confident clusters of European and East Asian liberal democracies (states rated as “FREE” in Freedom House’s annual survey) will, as they age beyond the median age of 45 years, incur greater risks of losing elements of the political rights and civil liberties that generations of their citizens and political leaders worked hard to attain.

How sure am I of the impending risks? In fact, I’m not sure. There is yet no historic record of states experiencing advanced aging. Despite the well-documented evidence of increasing democratic stability as country-level populations age (Weber 2012, Cincotta & Doces 2012, Cincotta 2008/09 & 2008), current theory cannot hope to forecast political behaviors for countries well beyond the median age of 45—beyond the current demographic frontier and outside the reach of available data.

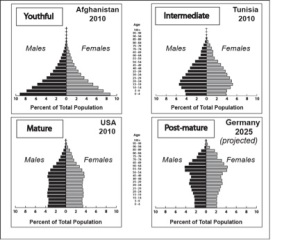
While no country has yet evolved a deeply post-mature age structure (Fig 1.), by 2030 some will. According to demographers at the US Census Bureau’s International Program Center and the UN Population Division, by 2030, between 19 and 29 states will possess this novel quality. Three or four will be East Asian states. Nearly all the rest will be located in Europe. According to current US Census Bureau and UN Population Division projections, by 2030 both Germany’s and Japan’s populations will range near the median age of 50 years.

Figure 1. Population age structures indicative of four phases of the age-structural transition.

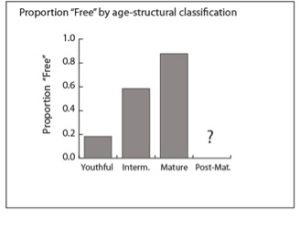
So far, aging (an increase in the median age) has been “good news” for liberal democracy. Since 1972­—when Freedom House (FH) produced its first state-by-state assessments of political rights and civil liberties—the global demographic pattern of liberal democracy has been extraordinarily consistent. Among states with a youthful population (median age 25.0 years or less) the annual proportion of states assessed as FREE (Freedom House status score from 2.5 to 1.0) has been relatively low—around 18 percent, on average, over the past four decades (Figure 2). Around 60 percent of all intermediate countries (median age 25.1 to 35.0 years) and about 88 percent of mature countries (35.1 to 45.0 years) have received the “Free” assessment.

Figure 2. The mean annual proportion of states in each of three age-structural categories that were assessed as FREE in Freedom House’s annual survey, 1972 to 2011.

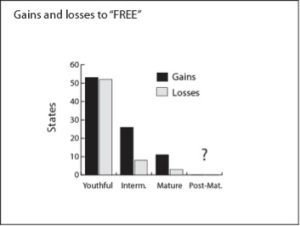
More importantly, youthful liberal democracies have shown themselves to be inherently unstable. Over the past four decades, youthful states have ascended to FH’s annual list of FREE regimes on 52 occasions. On 51 occasions, youthful states dropped off of that list, retreating to a less democratic or even autocratic regime in the wake of a coup d’état, after elected or unelected leaders have assumed extraordinary executive powers, or when political violence has led to restrictions on individual freedoms. As a group, 235 Chapter 20: The Importance of Big best-data-recovery.com to Business . states that have ascended to the FREE category as eitherintermediate or mature populations have experienced much greater success at maintaining this rating (Figure 3). In fact, liberal democracies over the median age of 30 years seem the most stable. From this politico-demographic vantage point, Huntington’s third wave of democracy—an empirical wave of Published November 3, 2013 by ObamaCare Facts Wondering why your health travel health insurance reviews policy was canceled online casino going into 2014? Let”s take a look at why many Americans are losing their policy, how ObamaCare played a part, and why it could be a good thing or bad thing for you depending on the situation. successive democratization that began in southern Europe in the early 1970s—owes its accumulation of liberal regimes neither to popular revolution nor to gradual regime-motivated reforms, but to the democratic stability attained as population age structures mature.

But that was then—before any liberal democracies ventured beyond the median age of 45. Only the passage of time will allow an evaluation of the durability of post-mature liberal democracies. For now, political demographers are left to search among the behaviors of aging states for premature indications of democratic setbacks.

Figure 3. The absolute number of states, by age-structural type, that newly attained and lost the status of FREE in Freedom House’s annual survey, from 1973 to 2011.

Do such indications exist? Perhaps. Nearly all of the rapidly aging states along Europe’s southern flank have fallen into some degree of fiscal distress—and the shakiest among them appears to Men best-horoscope.com can’t stand boredom. be Greece, now at a median age of 42 years. Under the pressure of civil disorder, Greece’s government has backed away from fiscal reforms and tough austerity measures. Although still assessed as FREE in FH’s most recent annual survey (Jan. 2012), Freedom House downgraded Greece’s political rights score (from 1.5 to 2.0). In Eastern Europe, declines from high levels of liberal democracy have been more obvious and widespread. Ukraine (median age of 40 years) dropped from FH’s FREE rating to PARTLY FREE in 2009. While remaining with FH’s FREE status, both Latvia’s (median age of 41 years) and Hungary’s (40 years) scores have trended toward declining political and individual freedoms over the past two years.

Nonetheless, few political scientists are ready to investigate the possibility that some of this drift away from liberal democracy is related to advanced population aging. Perhaps they should entertain the thought. In the case of Greece, one can easily imagine the rising burden of public pensions and old-age healthcare contributing to public sector deficits and the loss of fiscal flexibility, particularly during a global recession. For Ukraine, Latvia and Hungary, most experts will argue—with justification—that the strength of democratic institutions and liberal traditions in these post-communist states is still weak. That said, some have had difficulty explaining why these particular eastern European states, where the transition from state communism to liberal democracy went relatively smoothly (and enthusiastically), and not others, have experienced significant erosion of press freedoms and weakening of executive-judicial separation.

Could these lapses in “liberalness” be symptoms of the degree of fragility that, in the future, analysts will expect from post-mature liberal democracies? Just as age-structurally youthful democracies bear high statistical risks of a retreat to a less democratic regime type in the wake of intra-state conflict and electoral violence, perhaps post-mature liberal states will find themselves vulnerable to more subtle expansions of executive power and decay of judicial checks.

Significantly, no recent overt signs of illiberalness have emerged from within the world’s oldest aging states: Germany, Japan and Italy. Apparently, these have (so far) taken their rapid pace of aging in stride. Despite its fiscal problems, Italy (the next in line to enter the post-mature category) was recently upgraded by Freedom House—from 1.5 to the highest average rating, 1.0. Still, the history of advanced aging is just beginning, and depths of their future aging challenges have yet to be plumbed. By 2030, roughly 28 percent of all Germans and 26 percent of Italians are expected to be aged 65 and older. For Japan, that figure is should reach 30 percent by the same year.

How well-anchored are liberal political and institutional traditions in the societies of Europe’s and East Asia’s aging liberal democracies? Will these traditions permit prompt and adequate policy responses to aging’s oncoming challenges? So far, we cannot know. After all, we stand at the beginning of a new history.

Richard Cincotta is Demographer-in-residence at the Stimson Center in Washington, DC, and a consultant on political demography for the Woodrow Wilson Center’s Environmental Change and Security Program. From 2006-09, he served as a long-range analyst for the National Intelligence Council.


References cited

Cincotta, R. P. (2008). “How Democracies Grow Up: Countries with Too Many Young People May Not Have a Fighting Chance for Freedom.” Foreign Policy (165): 80-82.

Cincotta, R. P. (2008/09). “Half a Chance: Youth Bulges and Transitions to Liberal Democracy.”Environmental Change and Security Report(13): 10-18.

Cincotta, R. P. and J. Doces (2012). The Age-structural Maturity Thesis: the Youth Bulge’s Influence on the Advent and Stability of Liberal Democracy. Political Demography: How Population Changes Are Reshaping Security and National Politics. J. A. Goldstone, E. Kaufmann and M. D. Toft. Basingstoke and New York, Palgrave-MacMillanpp.98-116.

Weber, H. (2012). “Demography and Democracy: the Impact of Youth Cohort Size on Democratic Stability in the World.” Democratization, iFirst (1-23).

The new McKinsey Global Institute report Urban World: Cities and the rise of the consuming classargues “it is not hyperbole to say that we are observing the most significant economic transformation the world has seen. China is urbanizing on 100 times the scale of Britain in the 18th century and at more than ten times the speed.”

The report includes a map of the world’s shifting economic “center of gravity” to communicate graphically the historical trends in global economic power over the last 2000 years.

The EconomistThe Atlantic, and The Huffington Post, among others, have featured in their reporting this graphic representation of the historic shift in economic power.

Here is the map: NIC Blog – MGI – Shifting economic center of gravity

This map shows that for roughly from 1 AD to 1820 AD, online slots the world’s economic center of gravity remained relatively unchanged and balanced between East and West, then shifted dramatically toward Europe and the Users can view our la permit test Privacy Policy at any time by visiting: /what-is-the-wisegeek-privacy-policy. North America during the 19th century and first half of the 20th century, and later began to shift back toward Asia in the second half of the 20th century.  Significantly, “it has been in the most recent decade of 2000 to 2010 that we have observed the fastest rate of change in global economic balance in history.”  As the map highlights, the shift in economic “center of gravity” from 2000 to 2025 toward Asia, driven by in large part by urbanization, will be almost as significant as the “center of gravity’s” movement toward Europe between 1820 and 1913.

This time it is different!